.webp)
AT A GLANCE
Data normalization is the process of organizing and scaling data to eliminate redundancy, ensure consistency, and improve accuracy for analytics, machine learning, and transaction monitoring, case management. Whether you're designing databases or preparing data for machine learning, normalization makes your data cleaner, more reliable, and easier to work with. This guide covers everything from database normal forms to ML preprocessing techniques, plus the tools you need to get started.
Why Does Data Normalization Matter?
Bad data costs businesses millions. When companies make decisions based on messy, inconsistent, or duplicate data, they face inefficiencies, financial losses, and broken insights. At its essence, data normalization organizes data into a consistent format, solving three critical problems:
1. Eliminates redundancy and saves storage. Eliminating redundant data reduces wasted storage and maintenance headaches. When customer information exists in five different tables, updating one address means updating five records or risking inconsistencies that can distort risk scoring.
2. Prevents data anomalies. Unnormalized databases suffer from insertion, update, and deletion anomalies. Try adding a new product category before any products exist, or deleting a customer record that cascades through your entire system. Normalization prevents these issues.
3. Improves algorithm performance. In machine learning, features on different scales bias models. A dataset comparing building heights (in meters) against person ages (in years) will favor the larger-magnitude feature. Normalization ensures each variable contributes equally.
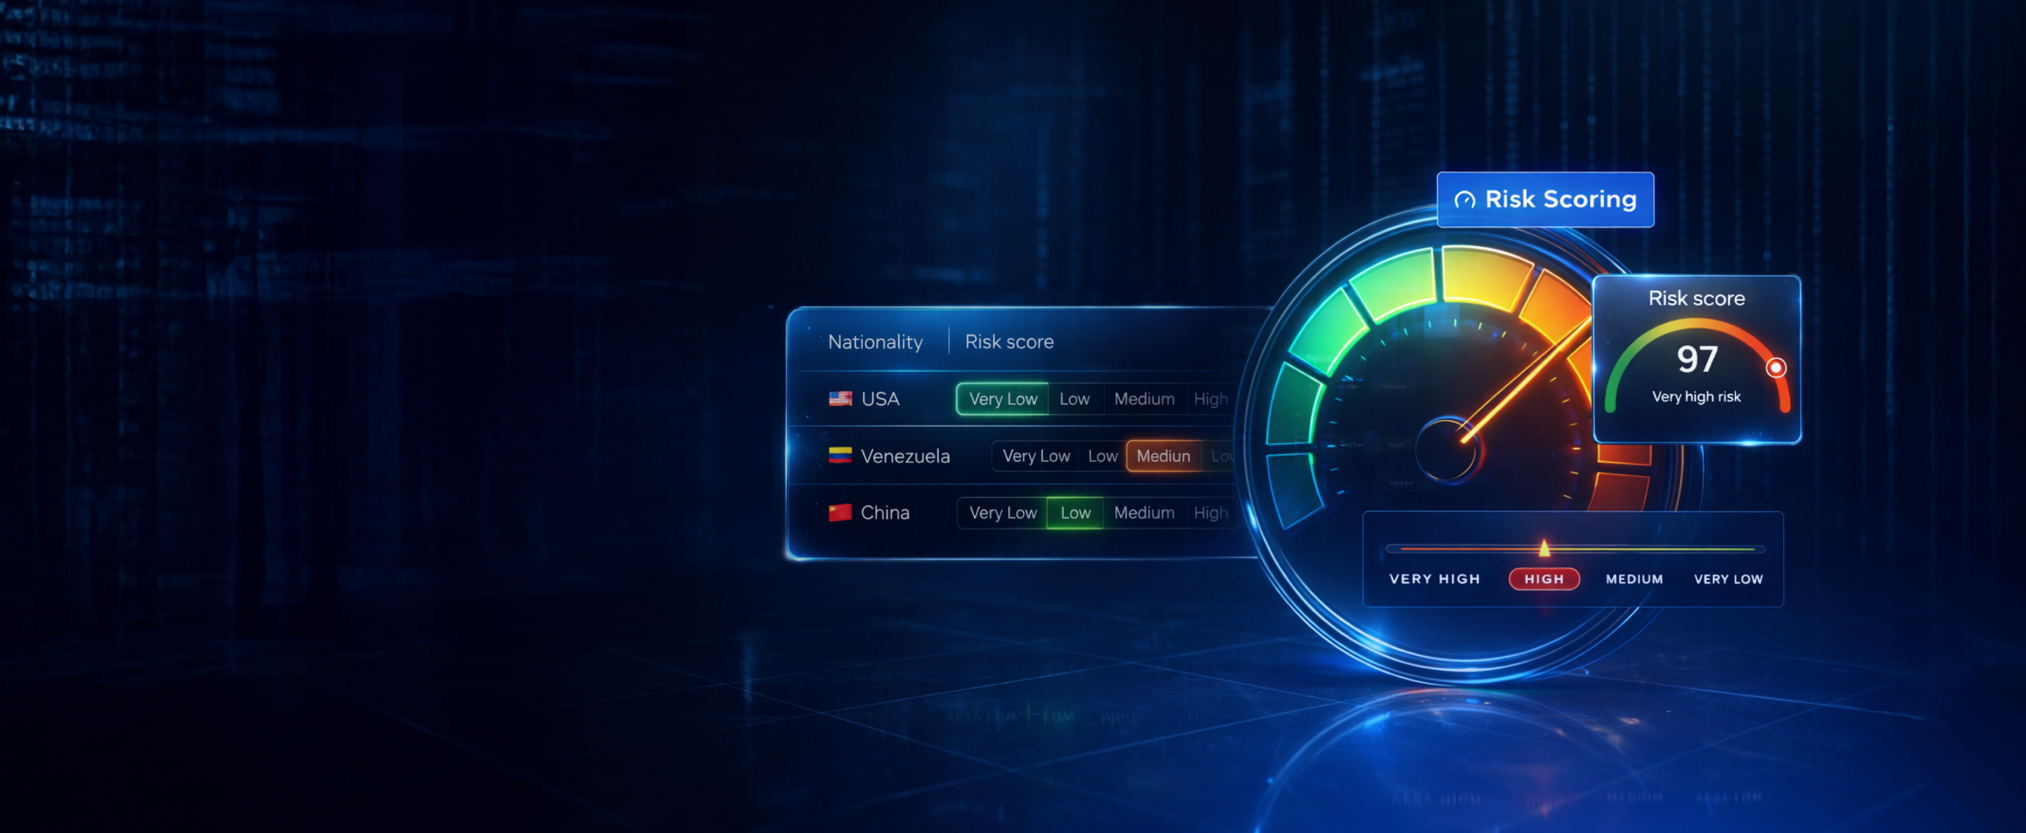
The stakes are especially high in compliance-heavy industries. Modern AML (anti-money laundering) systems rely on normalized data to accurately detect fraud patterns, improve watchlist screening, and meet regulatory requirements.
What Are the Two Main Types of Data Normalization?
Data normalization means different things depending on your context. Understanding both types prevents confusion and helps you choose the right approach.
Database Normalization
This organizes relational databases into structured tables that eliminate redundancy. Dr. E.F. Codd introduced this concept in the 1970s, creating a mathematical framework based on set theory and predicate logic.
Database normalization follows progressive stages called "normal forms." Each stage reduces redundancy and strengthens data integrity. Most production databases aim for Third Normal Form (3NF) or Boyce-Codd Normal Form (BCNF), which balances data purity with practical performance.
Data Preprocessing Normalization
This scales numerical features to a standard range before analysis or machine learning. Without it, algorithms treat a $1,000,000 transaction the same as a 5-star rating the magnitude overwhelms the model.
Preprocessing normalization uses techniques like Min-Max scaling (0 to 1 range) or Z-score standardization (mean of 0, standard deviation of 1). The goal: make different features comparable so models weigh them appropriately.
Key difference: Database normalization organizes structure; preprocessing normalization adjusts scale. Both transform data, but they solve different problems.
How Do You Normalize a Database?
Database normalization progresses through normal forms. Each level addresses specific types of redundancy and anomalies.
First Normal Form (1NF): Eliminate Repeating Groups
A table is in First normal form (1NF) when every column contains atomic (indivisible) values and has a primary key.
Before 1NF:
- Customer table with "Phone Numbers" column containing "555-0100, 555-0101, 555-0102"
After 1NF:
- Separate rows for each phone number, each linked to the customer via primary key
This eliminates arrays and sets, ensuring each data point occupies its own field.
Second Normal Form (2NF): Remove Partial Dependencies
Second normal form (2NF) builds on 1NF by eliminating partial dependencies. No column should depend on just part of a composite primary key.
Example: An order table with OrderID + ProductID as primary key shouldn't include ProductCategory that depends only on ProductID, not the full key. Move ProductCategory to a separate Products table.
Third Normal Form (3NF): Eliminate Transitive Dependencies
In Third normal form (3NF), non-key columns depend only on the primary key, not on other non-key columns.
Example: A customer table shouldn't include both ZipCode and City, because City depends on ZipCode (a transitive dependency). Create a separate ZipCodes table instead.
Boyce-Codd Normal Form (BCNF): Handle Edge Cases
Boyce-codd normal form (BCNF) tightens 3NF rules by requiring that, for any functional dependency X → Y, X must be a superkey (a unique identifier), catching corner cases that 3NF misses.
When to Stop Normalizing
Most applications stop at 3NF or BCNF. Higher forms, including Fourth normal form (4NF) and Fifth normal form (5NF), exist but add complexity with diminishing returns. Sometimes, slight denormalization, intentionally adding redundancy, improves query performance for read-heavy applications.
What Are the Best Data Normalization Techniques for Machine Learning?
Machine learning models need features on comparable scales. Here are the most effective normalization methods and when to use each.
Min-Max Scaling
Rescales features to a fixed range, typically [0, 1].
Formula: (x - min) / (max - min)
Use when: You need a specific range and your data has clear boundaries without many outliers. Works well for neural networks and image processing.
Limitation: Sensitive to outliers a single extreme value compresses all other values into a tiny range.
Z-Score Normalization (Standardization)
Centers data around zero with a standard deviation of 1 using Z-score normalization.
Formula: (x - mean) / (standard deviation)
Use when: Your data follows a normal distribution or you're using algorithms that assume normally distributed input (like linear regression, logistic regression, or SVMs).
Benefit: Less sensitive to outliers than Min-Max scaling, but extreme values still impact the mean and standard deviation.
Robust Scaling
Robust scaling uses the median and interquartile range instead of the mean and standard deviation.
Formula: (x - median) / IQR
Use when: Your dataset contains many outliers. This method is resilient because it uses statistics that outliers don't heavily influence.
L2 Normalization
Scales vectors so the sum of squared elements equals 1 using L2 normalization.
Use when: Working with text data (TF-IDF vectors), recommendation systems, or any algorithm using distance measures between samples rather than between features.
How to Choose the Right Technique
Ask three questions:
- Does my data have outliers? Use Robust Scaling if yes, Min-Max or Z-score if no.
- Does my algorithm assume normal distribution? Use Z-score standardization for linear models, SVMs, and neural networks.
- Do I need a specific range? Use Min-Max scaling when bounded values (like 0-1) are required.
Important: Some algorithms (decision trees, random forests) don't require normalization; they're invariant to feature scaling.
What Tools Should You Use for Data Normalization?
The right tools depend on your use case. Here's what works for databases, data science, and enterprise applications.
For Database Normalization
Relational Database Management Systems (RDBMS) enforce normalization rules through constraints and schema design:
- PostgreSQL and MySQL: Open-source options with strong normalization support via foreign keys, primary keys, and constraint checking
- Microsoft SQL Server: Enterprise-grade with SQL Server Management Studio (SSMS) for visual schema design
- Oracle Database: Handles complex enterprise schemas with advanced normalization features
These platforms let you define relationships, set constraints, and ensure data integrity at the database level.
For Data Science Normalization
Python libraries dominate machine learning preprocessing:
- Scikit-learn (Python): Offers MinMaxScaler, StandardScaler, RobustScaler, and Normalizer classes and is an industry standard for ML pipelines.
- Pandas (Python): Built-in methods for quick normalization during data exploration and cleaning.
- NumPy: Low-level array operations for custom normalization functions
R programming provides alternatives:
- Base R functions (scale, normalize) for statistical computing
- R (base and tidyverse): Tidyverse packages for data manipulation with normalization steps.
For ETL and Data Integration
Extract, Transform, Load (ETL) tools normalize data from multiple sources:
- Talend: Open-source platform with visual data integration and normalization workflows
- Informatica PowerCenter: Enterprise ETL with advanced data quality and normalization features
- Alteryx: User-friendly data blending with built-in cleansing and normalization tools
For Enterprise Data Management
Master Data Management (MDM) platforms maintain normalized data across organizations:
- Informatica MDM: Ensures consistent, normalized master data across systems
- SAP master data governance: Enterprise-scale data consistency and standardization
Data warehousing solutions like Amazon Redshift, Google BigQuery, and Snowflake handle normalized schemas at scale, optimizing storage and query performance.
How Do You Avoid Common Normalization Mistakes?
Even experienced teams make normalization errors. Here's how to avoid the most costly ones.
Mistake 1: Over-Normalizing
The problem: Over-normalization occurs when taking normalization to extremes creates too many tables with excessive join operations, degrading performance.
The fix: Stop at 3NF or BCNF for most applications. If queries become slow, strategic denormalization (intentionally adding redundancy) can improve read performance.
Mistake 2: Losing Important Information
The problem: Aggressive normalization strips away meaningful variance or context.
The fix: Back up original data before normalizing. After processing, compare statistical properties (variance, mean, distribution) to ensure you haven't removed the signal. Keep raw data accessible for auditing.
Mistake 3: Ignoring Data Distribution
The problem: Applying Min-Max scaling to outlier-heavy data compresses most values into a tiny range, making them indistinguishable.
The fix: Visualize your data first. Use histograms and box plots to spot outliers. Choose Robust Scaling for outlier-heavy datasets or consider outlier removal before normalization.
Mistake 4: Using One-Size-Fits-All Approaches
The problem: Applying the same normalization technique to all features regardless of their characteristics.
The fix: Normalize features individually based on their distribution and the algorithm requirements. Mixed approaches often work best Z-score for normally distributed features, Robust Scaling for skewed ones.
Mistake 5: Forgetting to Save Transformation Parameters
The problem: You normalize training data but can't reproduce the exact transformation on test or production data.
The fix: Save the parameters (min, max, mean, standard deviation) used during normalization. Apply the same parameters to new data. In Scikit-learn, use fit() on training data and transform() on test data never fit_transform() on test sets.
Mistake 6: Not Reassessing Over Time
The problem: Data distributions change, but normalization strategies stay static, leading to degraded model performance.
The fix: Monitor data drift. Revalidate normalization approaches quarterly or when data characteristics change significantly. Set up alerts for distribution shifts.
Mistake 7: Skipping Domain Expert Input
The problem: Purely mathematical normalization ignores business context and domain-specific nuances.
The fix: Collaborate with subject matter experts. They'll catch issues like seasonal patterns, business rules, or industry standards that affect how data should be normalized.
What Other Data Cleaning Techniques Work with Normalization?
Normalization is one piece of the data cleaning puzzle. Combine it with these complementary techniques for truly clean datasets.
Handling Missing Values
Deletion methods:
- Listwise deletion: Remove entire rows with missing values (quick but loses data)
- Pairwise deletion: Use available data for each analysis (preserves more information)
Imputation methods:
- Mean/median imputation: Replace missing values with column averages
- K-Nearest Neighbors imputation: Fill gaps based on similar records
- Model-based imputation: Use regression or machine learning to predict missing values
Outlier Detection and Treatment
Detection:
- Statistical methods: Z-score (values beyond 3 standard deviations), IQR method (beyond 1.5× interquartile range)
- Visualization: Box plots and scatter plots reveal extreme values
Treatment:
- Capping: Limit values to a maximum threshold
- Transformation: Apply log or square root functions to compress extremes
- Removal: Delete outliers if they're measurement errors
Encoding Categorical Variables
One-hot encoding: Creates binary columns for each category (use for nominal data like colors, cities)
Ordinal encoding: Assigns ordered integers (use for ranked data like education levels)
Binary encoding: Converts categories to binary code, reducing dimensionality compared to one-hot
Duplicate Detection
Exact matching: Identify and remove identical rows
Fuzzy matching: Find near-duplicates using string similarity algorithms (helpful for catching typos in names, addresses)
Feature engineering
Feature extraction: Techniques like principal component analysis (PCA) can reduce dimensionality while retaining most of the information.
Text Data Cleaning
Tokenization: Split text into individual words or terms
Stop word removal: Eliminate common words ("the," "and," "is") that add little meaning
Stemming and lemmatization:
Reduce words to their root form ("running" → "run")
Frequently Asked Questions
What's the difference between normalization and standardization?
Standardization Z-score normalization centers data around mean 0 with standard deviation 1. Normalization typically refers to Min-Max scaling (0-1 range), though the terms are sometimes used interchangeably. Both scale data, but standardization preserves outlier relationships while normalization compresses everything to a fixed range.
When should you NOT normalize data?
Skip normalization for tree-based algorithms (decision trees, random forests, gradient boosting) because they're scale-invariant. Also avoid it when the magnitude of values carries meaning like when comparing "small" purchases ($5) to "large" ones ($5000), where the scale difference matters.
Can you reverse data normalization?
Yes, if you save the transformation parameters. For Min-Max: original = normalized × (max - min) + min. For Z-score: original = (normalized × std_dev) + mean. Always store these parameters when normalizing production data.
How does normalization improve machine learning models?
Normalization helps gradient descent converge faster, prevents features with large magnitudes from dominating, and improves distance-based algorithm accuracy (KNN, K-means, SVM), including use cases like K-nearest neighbors (KNN) imputation. Models train faster and perform better when features are on comparable scales.
What's the difference between 3NF and BCNF?
3NF eliminates transitive dependencies (non-key attributes depending on other non-key attributes). BCNF is stricter; it requires that for every dependency X → Y, X must be a superkey. BCNF catches certain edge cases that 3NF misses, though both handle most practical scenarios.
Do you normalize before or after splitting train/test data?
Always split first, then normalize. Fit the normalization parameters (mean, standard deviation, min, max) on training data only, then apply those same parameters to test data. Fitting on combined data leaks information from the test set into training, inflating performance metrics.
How do you handle new categories in normalized production data?
Plan for unseen categories when encoding. Use strategies like: (1) "unknown" category buckets, (2) frequency-based encoding that maps rare categories to a default value, or (3) target encoding with smoothing to handle new categories gracefully.
What happens if you over-normalize a database?
You'll create too many tables with complex joins that slow queries. Reading data requires combining multiple tables, which increases computational overhead. Strategic denormalization adding controlled redundancy often improves read performance for reporting systems.
Key Takeaways for Cleaner Data
Start with clear goals. Know whether you're optimizing for storage efficiency (database normalization) or algorithm performance (preprocessing normalization) before choosing techniques. Tools like DataCleaner can help assess data structure and quality before making that decision.
Visualize first, normalize second. Understanding your data's distribution, outliers, and patterns prevents choosing the wrong method. Five minutes with a histogram saves hours of debugging.
Document your transformations. Save every parameter min, max, mean, standard deviation. You'll need them to normalize new data consistently and reverse transformations when necessary.
Test multiple methods. Try Min-Max, Z-score, and Robust Scaling on a sample. Measure model performance with each to find what works for your specific data and algorithms.
Monitor for drift. Data changes over time. Set quarterly reviews of your normalization strategy, especially for production ML systems and AI Forensics where distribution shifts degrade model accuracy.
Balance purity with practicality. Perfect normalization isn't always optimal normalization. Sometimes denormalizing a database improves query speed, or skipping normalization altogether works better for certain algorithms.
Preserve the original. Always keep a copy of raw data. Normalization should enhance data, not destroy information you might need later for auditing or reanalysis.
Effective data normalization, whether for databases or machine learning, is the foundation of reliable data systems. By organizing structure, scaling features appropriately, and avoiding common pitfalls, you transform chaotic raw data into clean, actionable information that drives better decisions and more accurate models. In regulated environments, this rigor also underpins any effective AML compliance solution. As highlighted in our last article, “The Rising Threat of Identity Fraud,” the stakes have never been higher. In essence, mastering data normalization and cleaning is not just a technical requirement but a cornerstone of responsible and secure digital operations.